
How To Automate GA4 + GSC Report
Every month, I need to report on the traffic performance of five websites and analyze what can be done to increase their visitors.
I usually collect the data from Google Search Console and Google Analytics 4 (GA4). The problem is that compiling the data, analyzing it, and turning it into a report can take quite a lot of time—especially when you have to repeat the same process every month.
To make this process easier, I built a simple program that can generate the same report with just one command.
If you also manage multiple websites and spend a lot of time creating monthly traffic reports from Google Search Console and GA4, this article may be useful for you.
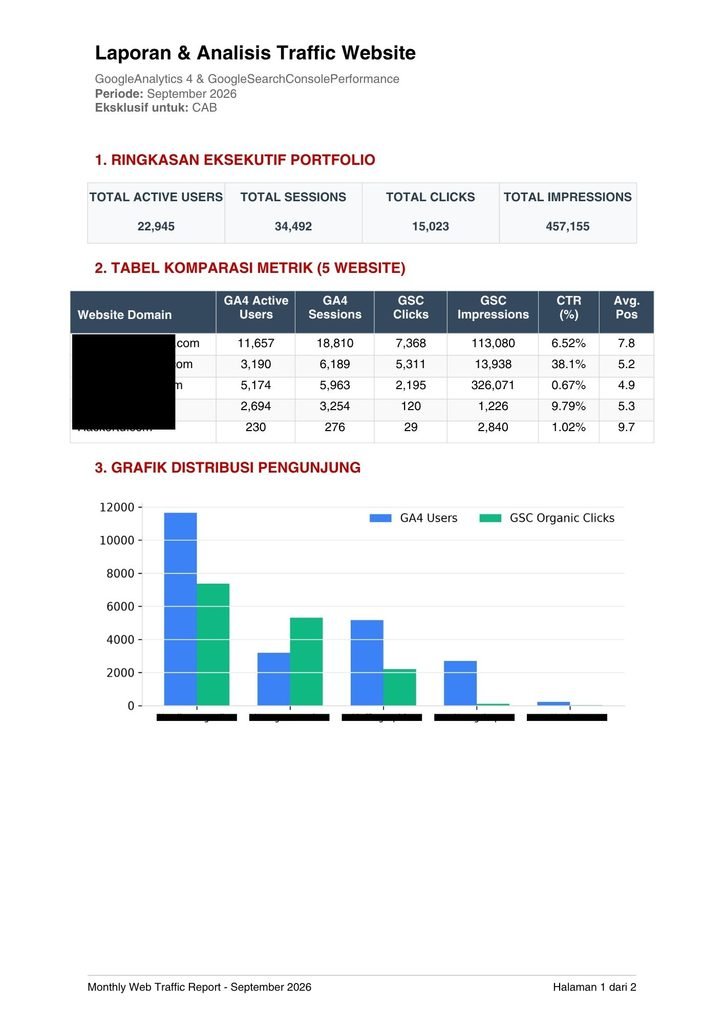
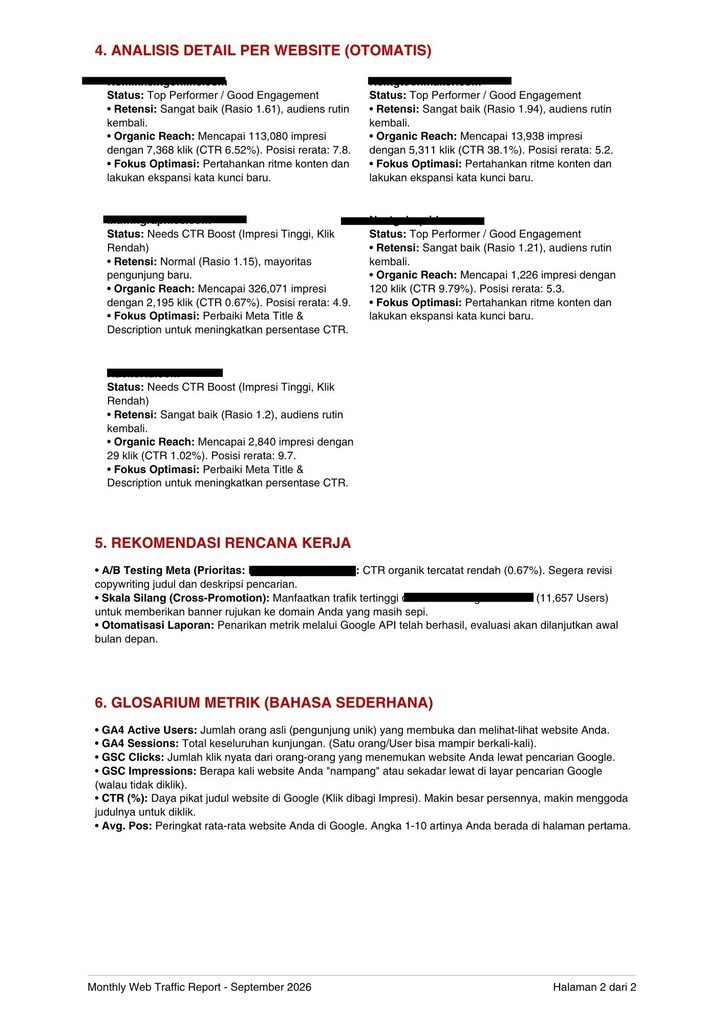
This guide provides step-by-step instructions to set up, configure, and run the Python script that automates monthly Google Search Console (GSC) and Google Analytics 4 (GA4) PDF reporting.
Prerequisites
- Python 3.7 or higher installed on your computer.
- Administrative access to your Google Search Console and Google Analytics 4 accounts.
Phase 1: Generate Google Service Account Credentials
The script requires a dedicated Google Service Account to securely fetch data from your GA4 and GSC properties.
- Go to the Google Cloud Console.
- Create a new project (e.g.,
SEO-Report-Agent). - Navigate to APIs & Services > Library and enable the following two APIs:
- Google Search Console API
- Google Analytics Data API
- Navigate to APIs & Services > Credentials.
- Click + CREATE CREDENTIALS > Service account.
- Name the service account (e.g.,
traffic-reporter) and click Create and Continue, then Done. - In the Credentials list, click on the newly created Service Account email.
- Go to the Keys tab, click Add Key > Create new key, select JSON, and click Create.
- The
.jsonfile will automatically download. Rename this file tocredentials.jsonand keep it secure.
Phase 2: Grant Permissions to the Service Account
You must explicitly grant the Service Account email (found inside your credentials.json, looking like traffic-reporter@...iam.gserviceaccount.com) access to your websites.
A. Google Search Console (GSC)
Repeat this for every website.
- Open Google Search Console.
- Select your property from the top-left dropdown.
- Go to Settings > Users and permissions.
- Click Add User, paste the Service Account email, set the Permission to Restricted (or Full), and click Add.
B. Google Analytics 4 (GA4)
Repeat this for every website.
- Open Google Analytics.
- Click the Admin (Gear icon) in the bottom left.
- Under the Property column, select Property Access Management.
- Click the + icon (top right) and choose Add users.
- Paste the Service Account email, assign the Viewer role, and click Add.
- Important: While in the Admin area, go to Property Details and copy the PROPERTY ID (a 9-digit number) for Phase 4.
Phase 3: Local Environment Setup
- Create a new folder on your computer (e.g.,
D:\laporan-seo). - Move the
credentials.jsonfile into this folder. - Save the provided Python script in this folder and name it
laporan_pdf.py. - Open your Terminal (macOS/Linux) or PowerShell / Command Prompt (Windows) and navigate to your folder:Bash
cd D:\laporan-seo - Install the required Python libraries by running:Bash
pip install google-api-python-client google-auth google-analytics-data reportlab matplotlib
Phase 4: Script Configuration
Open laporan_pdf.py in a text editor (like VS Code or Notepad). Locate the DOMAINS variable (around line 30) and update it with your actual website details:
Python
import os
import datetime
import matplotlib.pyplot as plt
from google.oauth2 import service_account
from googleapiclient.discovery import build
from google.analytics.data_v1beta import BetaAnalyticsDataClient
from google.analytics.data_v1beta.types import DateRange, Metric, RunReportRequest

from reportlab.lib import colors
from reportlab.lib.pagesizes import A4
from reportlab.platypus import SimpleDocTemplate, Table, TableStyle, Paragraph, Spacer, Image, PageBreak
from reportlab.lib.styles import getSampleStyleSheet, ParagraphStyle
from reportlab.lib.units import inch

# ==========================================
# 1. KONFIGURASI
# ==========================================
KEY_FILE_LOCATION = "credentials.json"
RECIPIENT_EMAIL = "ywinardi@gmail.com"

today = datetime.date.today()
first_day_this_month = today.replace(day=1)
last_day_last_month = first_day_this_month - datetime.timedelta(days=1)
first_day_last_month = last_day_last_month.replace(day=1)

START_DATE = first_day_last_month.strftime("%Y-%m-%d")
END_DATE = last_day_last_month.strftime("%Y-%m-%d")
MONTH_NAME = first_day_last_month.strftime("%B %Y")

DOMAINS = [
    {"name": "Domain1.com", "gsc_url": "https://Domain1.com/", "ga4_id": "123456789"},
    {"name": "Domain2.com", "gsc_url": "https://Domain2.com/", "ga4_id": "123456789"},
    {"name": "Domain3.com", "gsc_url": "https://Domain3.com/", "ga4_id": "123456789"},
    {"name": "Domain4.id", "gsc_url": "https://Domain4.id/", "ga4_id": "123456789"},
    {"name": "Domain5.com", "gsc_url": "https://Domain5.com/", "ga4_id": "123456789"}
]

try:
    credentials = service_account.Credentials.from_service_account_file(
        KEY_FILE_LOCATION,
        scopes=['https://www.googleapis.com/auth/webmasters.readonly', 'https://www.googleapis.com/auth/analytics.readonly']
    )
except Exception as e:
    print(f"❌ Error memuat credentials: {e}")
    exit()

# ==========================================
# 2. FUNGSI PENARIKAN DATA
# ==========================================
def get_gsc_data(site_url):
    try:
        service = build('searchconsole', 'v1', credentials=credentials)
        req = {'startDate': START_DATE, 'endDate': END_DATE, 'searchType': 'web'}
        res = service.searchanalytics().query(siteUrl=site_url, body=req).execute()

        if 'rows' in res and len(res['rows']) > 0:
            row = res['rows'][0]
            clicks = row.get('clicks', 0)
            impressions = row.get('impressions', 0)
            ctr = round(row.get('ctr', 0) * 100, 2)
            pos = round(row.get('position', 0), 1)
            return clicks, impressions, ctr, pos
        else:
            return 0, 0, 0, 0
    except Exception as e:
        print(f"\n❌ ERROR GSC [{site_url}]: {e}\n")
        return 0, 0, 0, 0

def get_ga4_data(property_id):
    try:
        client = BetaAnalyticsDataClient(credentials=credentials)
        req = RunReportRequest(
            property=f"properties/{property_id}",
            date_ranges=[DateRange(start_date=START_DATE, end_date=END_DATE)],
            metrics=[Metric(name="activeUsers"), Metric(name="sessions")]
        )
        res = client.run_report(req)
        if res.rows:
            return res.rows[0].metric_values[0].value, res.rows[0].metric_values[1].value
        return 0, 0
    except Exception as e:
        print(f"\n❌ ERROR GA4 [Property {property_id}]: {e}\n")
        return 0, 0

# ==========================================
# 3. FUNGSI ANALISA DINAMIS
# ==========================================
def generate_analysis_text(d):
    users = int(d['users'])
    sessions = int(d['sessions'])
    clicks = int(d['clicks'])
    imp = int(d['impressions'])
    ctr = float(d['ctr'])
    pos = float(d['pos'])

    retention = round(sessions / users, 2) if users > 0 else 0

    if users == 0 and imp == 0:
        status = "Menunggu Data / Tidak Ada Trafik"
    elif ctr > 5.0 and users > 1000:
        status = "Top Performer / Good Engagement"
    elif imp > 1000 and ctr < 3.0:
        status = "Needs CTR Boost (Impresi Tinggi, Klik Rendah)"
    elif retention > 1.2:
        status = "High Intent / Good Retention"
    else:
        status = "Stable / Developing"

    if retention >= 1.2:
        ret_text = f"Sangat baik (Rasio {retention}), audiens rutin kembali."
    elif retention > 0:
        ret_text = f"Normal (Rasio {retention}), mayoritas pengunjung baru."
    else:
        ret_text = "Belum ada data interaksi pengguna (0)."

    if imp > 0:
        reach_text = f"Mencapai {imp:,} impresi dengan {clicks:,} klik (CTR {ctr}%). Posisi rerata: {pos}."
    else:
        reach_text = "Belum ada kemunculan di pencarian organik."

    if users == 0 and imp == 0:
        optimasi = "Cek instalasi script Google Analytics dan hak akses Search Console."
    elif imp > 1000 and ctr < 5.0:
        optimasi = "Perbaiki Meta Title & Description untuk meningkatkan persentase CTR."
    elif pos > 15 and imp > 100:
        optimasi = "Fokus optimasi kata kunci on-page agar posisi naik ke halaman utama."
    elif users > 100 and retention < 1.1:
        optimasi = "Perkaya konten atau tambahkan internal link agar pengunjung bertahan lebih lama."
    else:
        optimasi = "Pertahankan ritme konten dan lakukan ekspansi kata kunci baru."

    return f"""<b>{d['name']}</b><br/>
    <b>Status:</b> {status}<br/>
    • <b>Retensi:</b> {ret_text}<br/>
    • <b>Organic Reach:</b> {reach_text}<br/>
    • <b>Fokus Optimasi:</b> {optimasi}"""

def generate_recommendations(data_list):
    rekomendasi = ""
    low_ctr_sites = [d for d in data_list if int(d['impressions']) > 100 and float(d['ctr']) < 5.0]
    if low_ctr_sites:
        worst_ctr = sorted(low_ctr_sites, key=lambda x: float(x['ctr']))[0]
        rekomendasi += f"• <b>A/B Testing Meta (Prioritas: {worst_ctr['name']}):</b> CTR organik tercatat rendah ({worst_ctr['ctr']}%). Segera revisi copywriting judul dan deskripsi pencarian.<br/>"
    else:
        rekomendasi += "• <b>Optimasi Meta Data:</b> Lakukan evaluasi berkala pada judul artikel untuk menjaga CTR.<br/>"

    if data_list:
        top_site = sorted(data_list, key=lambda x: int(x['users']), reverse=True)[0]
        if int(top_site['users']) > 0:
            rekomendasi += f"• <b>Skala Silang (Cross-Promotion):</b> Manfaatkan trafik tertinggi dari {top_site['name']} ({int(top_site['users']):,} Users) untuk memberikan banner rujukan ke domain Anda yang masih sepi.<br/>"

    zero_sites = [d['name'] for d in data_list if int(d['users']) == 0 and int(d['impressions']) == 0]
    if zero_sites:
        rekomendasi += f"• <b>Investigasi Tracking:</b> Domain {', '.join(zero_sites)} bernilai 0 mutlak. Harap periksa apakah tag GA4 dan GSC sudah terpasang dan diverifikasi dengan benar.<br/>"

    rekomendasi += "• <b>Otomatisasi Laporan:</b> Penarikan metrik melalui Google API telah berhasil, evaluasi akan dilanjutkan awal bulan depan.<br/>"
    return rekomendasi

# ==========================================
# 4. FUNGSI PEMBUATAN GRAFIK (MATPLOTLIB)
# ==========================================
def create_chart(data_list):
    names = [d['name'].split('.')[0].capitalize() for d in data_list]
    users = [int(d['users']) for d in data_list]
    clicks = [int(d['clicks']) for d in data_list]

    x = range(len(names))
    width = 0.35

    fig, ax = plt.subplots(figsize=(7, 3))
    ax.bar([i - width/2 for i in x], users, width, label='GA4 Users', color='#3b82f6')
    ax.bar([i + width/2 for i in x], clicks, width, label='GSC Organic Clicks', color='#10b981')

    ax.set_xticks(x)
    ax.set_xticklabels(names, fontsize=8)
    ax.legend(loc='upper right', frameon=False, ncol=2)
    ax.spines['top'].set_visible(False)
    ax.spines['right'].set_visible(False)
    ax.spines['left'].set_color('#dddddd')
    ax.spines['bottom'].set_color('#dddddd')
    ax.yaxis.grid(True, color='#eeeeee')

    chart_path = "temp_chart.png"
    plt.tight_layout()
    plt.savefig(chart_path, dpi=300)
    plt.close()
    return chart_path

# ==========================================
# 5. FUNGSI FOOTER HALAMAN
# ==========================================
def add_footer(canvas, doc):
    canvas.saveState()
    canvas.setFont('Helvetica', 9)
    canvas.setStrokeColor(colors.lightgrey)
    canvas.line(doc.leftMargin, doc.bottomMargin - 10, doc.width + doc.leftMargin, doc.bottomMargin - 10)
    footer_text = f"Monthly Web Traffic Report - {MONTH_NAME}"
    page_text = f"Halaman {doc.page} dari 2"
    canvas.drawString(doc.leftMargin, doc.bottomMargin - 25, footer_text)
    canvas.drawRightString(doc.width + doc.leftMargin, doc.bottomMargin - 25, page_text)
    canvas.restoreState()

# ==========================================
# 6. PEMBUATAN PDF
# ==========================================
def generate_pdf(data_list, filename):
    doc = SimpleDocTemplate(filename, pagesize=A4, topMargin=30, bottomMargin=50)
    elements = []
    styles = getSampleStyleSheet()

    title_style = ParagraphStyle('TitleCustom', parent=styles['Heading1'], fontSize=16, spaceAfter=2)
    sub_style = ParagraphStyle('SubCustom', parent=styles['Normal'], fontSize=10, textColor=colors.dimgrey)
    header_style = ParagraphStyle('Header', parent=styles['Heading2'], fontSize=12, textColor=colors.HexColor("#C00000"), spaceBefore=15)

    elements.append(Paragraph("<b>Laporan & Analisis Traffic Website</b>", title_style))
    elements.append(Paragraph("Google Analytics 4 & Google Search Console Performance", sub_style))
    elements.append(Paragraph(f"<b>Periode:</b> {MONTH_NAME}", sub_style))
    elements.append(Paragraph(f"<b>Penerima:</b> {RECIPIENT_EMAIL}", sub_style))
    elements.append(Spacer(1, 15))

    elements.append(Paragraph("<b>1. RINGKASAN EKSEKUTIF PORTFOLIO</b>", header_style))
    total_users = sum(int(d['users']) for d in data_list)
    total_sessions = sum(int(d['sessions']) for d in data_list)
    total_clicks = sum(int(d['clicks']) for d in data_list)
    total_imp = sum(int(d['impressions']) for d in data_list)

    summary_data = [
        ["TOTAL ACTIVE USERS\n\n" + f"{total_users:,}", "TOTAL SESSIONS\n\n" + f"{total_sessions:,}",
         "TOTAL CLICKS\n\n" + f"{total_clicks:,}", "TOTAL IMPRESSIONS\n\n" + f"{total_imp:,}"]
    ]
    t_summary = Table(summary_data, colWidths=[doc.width/4]*4, rowHeights=[50])
    t_summary.setStyle(TableStyle([
        ('BACKGROUND', (0,0), (-1,-1), colors.HexColor("#F8F9FA")),
        ('ALIGN', (0,0), (-1,-1), 'CENTER'),
        ('VALIGN', (0,0), (-1,-1), 'MIDDLE'),
        ('FONTNAME', (0,0), (-1,-1), 'Helvetica-Bold'),
        ('TEXTCOLOR', (0,0), (-1,-1), colors.HexColor("#2C3E50")),
        ('GRID', (0,0), (-1,-1), 0.5, colors.lightgrey),
    ]))
    elements.append(t_summary)

    elements.append(Paragraph("<b>2. TABEL KOMPARASI METRIK (5 WEBSITE)</b>", header_style))
    table_data = [["Website Domain", "GA4 Active\nUsers", "GA4\nSessions", "GSC\nClicks", "GSC\nImpressions", "CTR\n(%)", "Avg.\nPos"]]
    for d in data_list:
        table_data.append([
            d['name'], f"{int(d['users']):,}", f"{int(d['sessions']):,}",
            f"{int(d['clicks']):,}", f"{int(d['impressions']):,}", f"{d['ctr']}%", str(d['pos'])
        ])

    t_comp = Table(table_data, colWidths=[120, 65, 65, 60, 75, 50, 45])
    t_comp.setStyle(TableStyle([
        ('BACKGROUND', (0,0), (-1,0), colors.HexColor("#34495E")),
        ('TEXTCOLOR', (0,0), (-1,0), colors.whitesmoke),
        ('ALIGN', (1,0), (-1,-1), 'CENTER'),
        ('FONTNAME', (0,0), (-1,0), 'Helvetica-Bold'),
        ('BOTTOMPADDING', (0,0), (-1,0), 8),
        ('GRID', (0,0), (-1,-1), 0.5, colors.lightgrey),
        ('ROWBACKGROUNDS', (0,1), (-1,-1), [colors.white, colors.HexColor("#F9F9F9")])
    ]))
    elements.append(t_comp)

    elements.append(Paragraph("<b>3. GRAFIK DISTRIBUSI PENGUNJUNG</b>", header_style))
    chart_img = create_chart(data_list)
    elements.append(Image(chart_img, width=doc.width, height=2.8*inch))

    elements.append(PageBreak())

    elements.append(Paragraph("<b>4. ANALISIS DETAIL PER WEBSITE (OTOMATIS)</b>", header_style))

    p_style = ParagraphStyle('Normal', fontSize=9, leading=12)
    analysis_paragraphs = [Paragraph(generate_analysis_text(d), p_style) for d in data_list]

    # Format tabel dua kolom untuk list website
    if len(analysis_paragraphs) % 2 != 0:
        analysis_paragraphs.append(Paragraph("", p_style))

    analysis_table_data = []
    for i in range(0, len(analysis_paragraphs), 2):
        analysis_table_data.append([analysis_paragraphs[i], analysis_paragraphs[i+1]])

    t_analysis = Table(analysis_table_data, colWidths=[doc.width/2 - 10, doc.width/2 - 10])
    t_analysis.setStyle(TableStyle([
        ('VALIGN', (0,0), (-1,-1), 'TOP'),
        ('BOTTOMPADDING', (0,0), (-1,-1), 15),
    ]))
    elements.append(t_analysis)

    elements.append(Paragraph("<b>5. REKOMENDASI RENCANA KERJA</b>", header_style))
    rekomendasi = generate_recommendations(data_list)
    elements.append(Paragraph(rekomendasi, p_style))

    doc.build(elements, onFirstPage=add_footer, onLaterPages=add_footer)

    if os.path.exists("temp_chart.png"):
        os.remove("temp_chart.png")

# ==========================================
# 7. JALANKAN PROGRAM UTAMA
# ==========================================
if __name__ == "__main__":
    print(f"\nMengambil data untuk periode: {START_DATE} s/d {END_DATE}...\n")
    hasil_data = []

    for site in DOMAINS:
        print(f"🔄 Memproses {site['name']}...")
        clicks, impressions, ctr, pos = get_gsc_data(site["gsc_url"])
        users, sessions = get_ga4_data(site["ga4_id"])

        hasil_data.append({
            "name": site["name"], "users": users, "sessions": sessions,
            "clicks": clicks, "impressions": impressions, "ctr": ctr, "pos": pos
        })

    pdf_filename = f"Laporan_Traffic_{MONTH_NAME.replace(' ', '_')}.pdf"
    generate_pdf(hasil_data, pdf_filename)
    print(f"\n✅ BERHASIL! File PDF telah dibuat: {pdf_filename}")
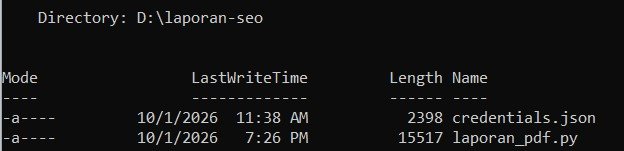
At the end you only need these 2 files, the report will generated automatically when you run laporan-pdf.py file. Credentials.json produced in Phase 1.
Phase 5: Execution
To generate the monthly report, open your Terminal / PowerShell in the project folder and run:
Bash
python laporan_pdf.py
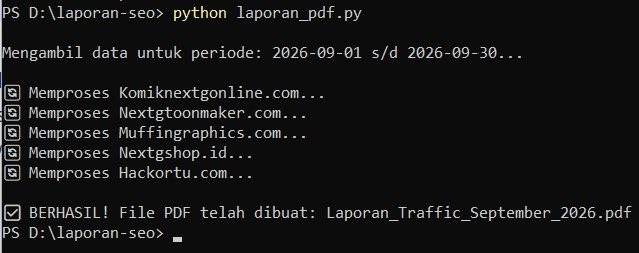
Expected Output: The script will display the processing status for each domain in the terminal. Once completed, a success message will appear, and a new file named Laporan_Traffic_[Month_Year].pdf will be generated in the exact same folder.